over 6 years ago
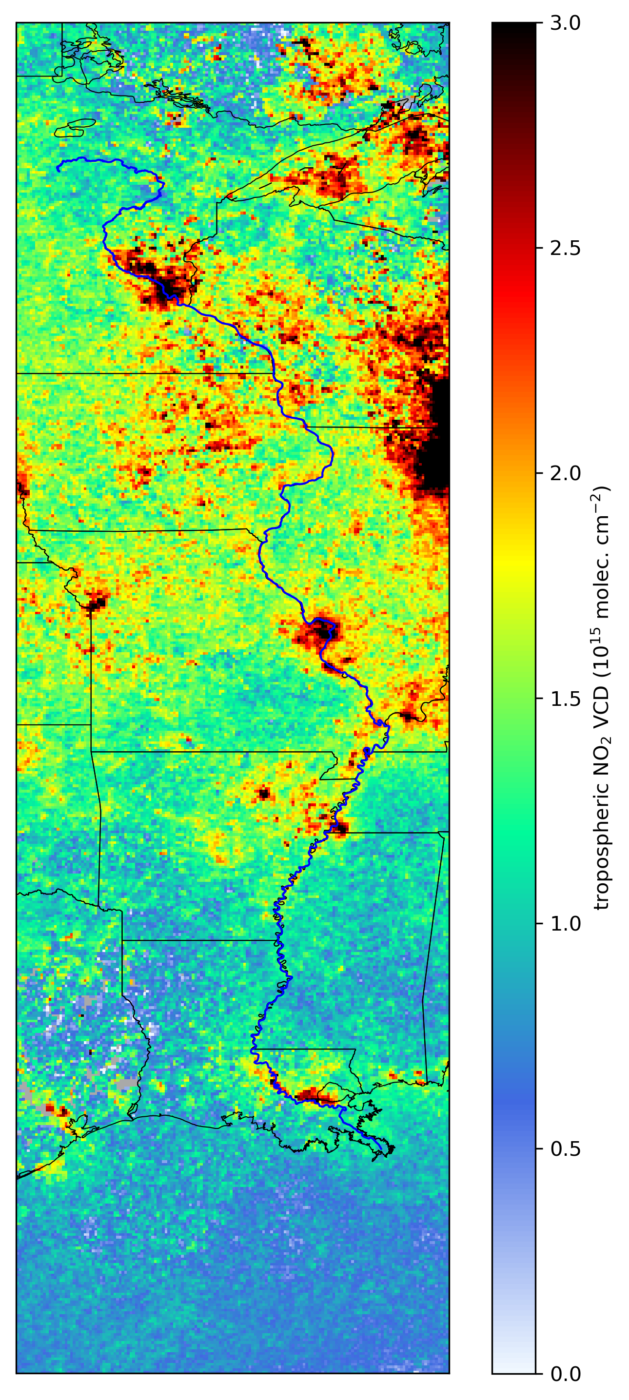
The map shows the average tropospheric nitrogen dioxide (NO2) column density for the period 16 to 22 September 2019 as measured by the S5p/TROPOMI satellite which monitores air pollution. The spatial features are similar to those of a long term average. However, as expected there is more noise in the map for the shorter averaging time. Also, the extension of several regions with enhanced NO2 values is sligtly smaller than in the long term average map. This is probably related to the shorter atmospheric lifetime of NO2 in summer. Source: Max Planck Institute for Chemistry