over 6 years ago
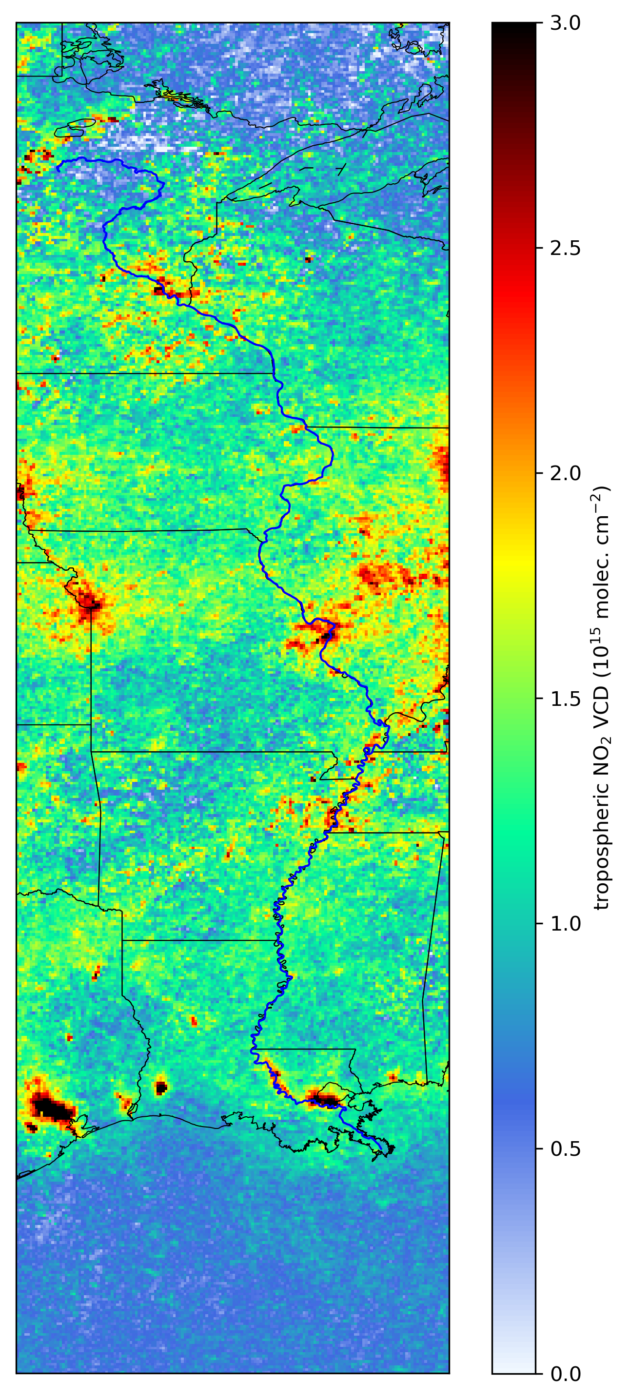
This is the second satellite map of a series produced by the Max Planck Institute for Chemistry during the time of the River Journey. It shows the average tropospheric nitrogen dioxide distribution along the Mississippi watershed for the period 23 to 29 September 2019. Compared to the previous week, NO2 columns are lower in the North, but higher in the South.
Note that the actual column values result from the interaction of NOx emissions, lifetime, and transport.
Note that the actual column values result from the interaction of NOx emissions, lifetime, and transport.