over 6 years ago
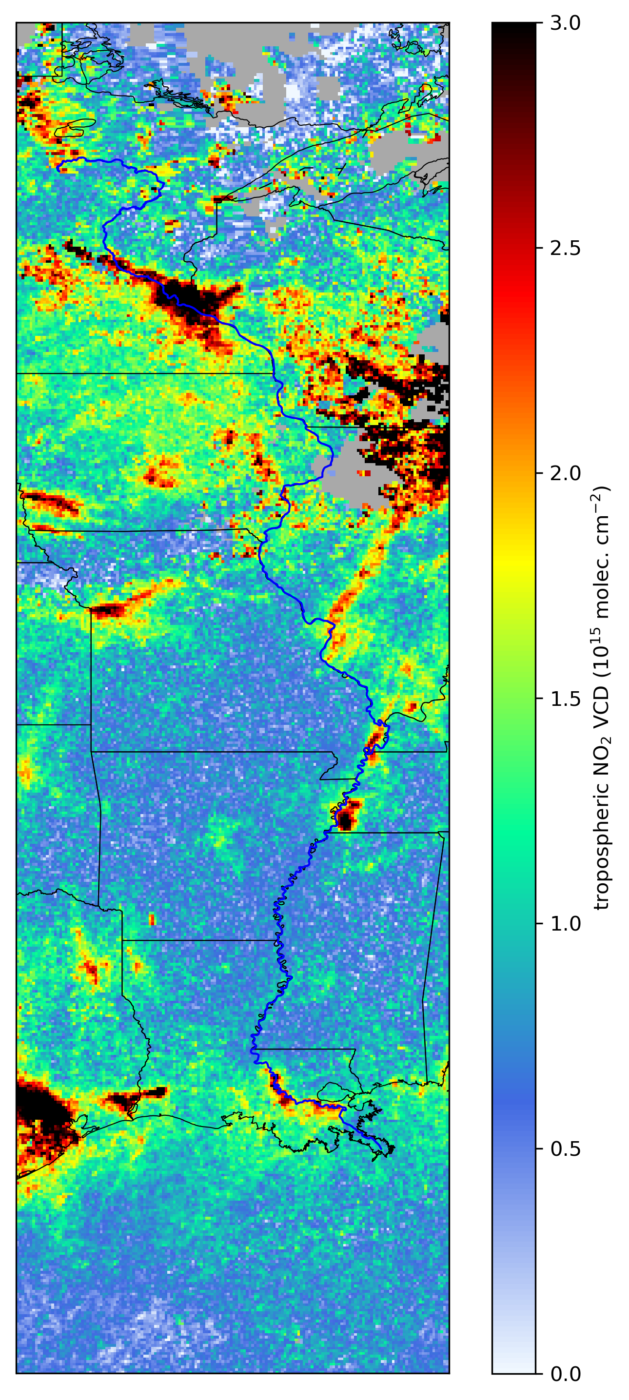
'The map shows the average tropospheric NO2 column density for the period 28 October to 03 November 2019. It reveals an interesting feature related to the number of availabe satellite data during the week: In the North-Eastern part, measurements were availabe only for one or two days, and even gaps due to missing data appear. Missing data are mainly caused by persistent cloud cover. Interestingly, in the areas where only few measurements are available, the spatial contours of the pollution patterns are more clear than for the previous weeks due to less spatial smearing.'